
More often than not development teams are pounded by requests with only a subjective analysis of what work should be done. We see this is many areas and automation is no different. Fortunately, I came up with a method for evaluating potential value of a development request and understanding comparatively where it aligns with other requests. Understand the concept and tweak it to work for you! Sit tight, there is a lot to cover with this solution that employs a number of different tools. Let’s get automating!
The first thing we need is a a place for our data. Most dev request are submitted via an ITSM system and a ticket is generated. Lets assume you have this but that system is not particularly catering to all of your needs. At the same time its never a good idea to circumnavigate these governance checkpoints in an organization. My words of wisdom are to first see if you can add necessary data fields to your current source for dev request intake or build a tool in which to integrate. In my case it’s the latter. I’ve chosen SharePoint for my data source.
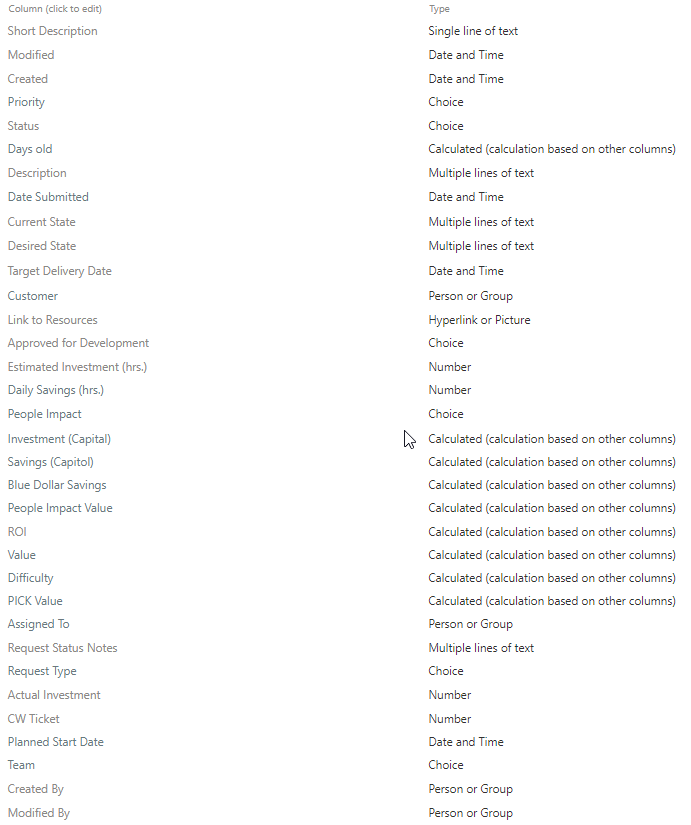
The fields will vary depending on your requirements, but lets focus on the critical:
- Estimate of Investment (hrs)
- Estimate of Daily Savings (hrs)
- Investment (Capital)
- Savings (Capital)
- Blue Dollars Savings
- People Impact
- People Impact Value
- ROI (Return on Investment)
- Difficulty
- Value
- PICK Value
I utilize other columns (seen below) so make this your own. Though for this read we will focus on the above.
Lets start breaking down how our fields are constructed and the meaning behind each. Estimate hours of investment and estimate hours are pretty straight forward. How many hours will this take to develop and how many hours will this save if deployed. In the next steps we define how the manpower will translate to fat stacks of dollars. In SharePoint we can easily define the next two values:
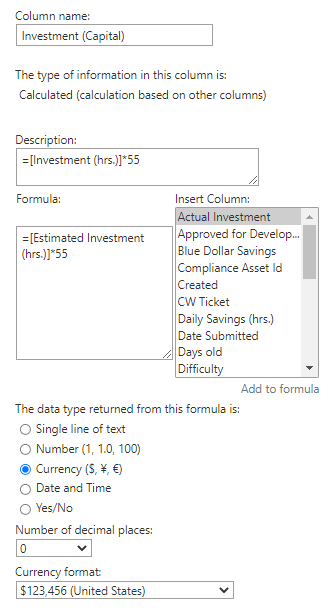
=[Estimated Investment (hrs.)]*55The above may vary, but we are just taking hours investment and multiplying by a currency rate. We do this same thing for Savings (Capital) and we can now take these values to compute Blue Dollars (Potential or Real). Again, make this value your own:
=[Savings (Capital)]*365Lets get our ROI now as well
=[Blue Dollar Savings]/[Investment (Capital)]Next we define people impact, as this addresses the scope and impact of the development. For us this starts as a single business all the way up to enterprise and beyond e.g., customer impacting. This is important as it acts as a multiplier when we consider the value of the development. People Impact Value is defined as follows:
=IF([People Impact]="Patient Affecting","53.234375",IF([People Impact]="Enterprise","53.234375",IF([People Impact]="Multiple Units","48.234375",IF([People Impact]="Single Unit","43.234375"))))Lets define difficulty:
=([Estimated Investment (hrs.)]/321)*100
Now we are ready to get the all important value score. Here we just take the People impact value add it to the ROI. I also want to limit this value to 100 if it exceeds. This is important later for accompanying the PICK process and we digest this into Power BI.
=IF(([People Impact Value]+ROI)>100,100,([People Impact Value]+ROI))Finally lets address the PICK value. If you are unfamiliar with the PICK process go hop on the Google and learn up. I find this process to be very valuable. In a nutshell we will take the info we supplied above and set some conditions that map to Possible, Implement, Challenge and Kill (thus the name PICK).
=IF(AND(Difficulty<50,Value<50),"Possible",(IF(AND(Difficulty>50,Value>50),"Challenge",(IF(AND(Difficulty<50,Value>50),"Implement",(IF(AND(Difficulty>50,Value<50),"Kill")))))))It’s helpful to see this value, but what we are really setting up for is to get this into POWER BI.

We now have a data source that puts some context around a development request. It doesn’t make the decision for us, but it helps add some details and gets our gears turning. Not everything we do in automation has a direct impact on the almighty savings of someone doing a thing. For instance, maybe we need an automation that will take Security recommendations and automatically remediated. Sometimes its less about the time it would take someone to get the job done, and more so the value gained in not being owned. Again, make this work for your own org. In subsequent reads, we will take this a step further. Let’s use Power Apps on the front-end to create an intake process for our end-users and lets use Power BI on the back-end to drive additional insight to the data here. In the middle of all this lets use Power Automate to facilitate some back and forth with customers and our ITSM.